고정 헤더 영역
상세 컨텐츠
본문
Art Basel은 UBS와 매년 미술 시장에 대한 작업을 한다.
아래는 The Art Market 2021 리포트의 요약 내용을 옮겨와 봤다.

Chapter 1 The Global Art Market in 2020
Chapter 1 provides an overview of the global art market in 2020, reporting on how the COVID-19 pandemic has affected the value, volume, and regional distribution of sales of art and antiques. It also gives a brief overview of sales in the largest art markets over a 10-year period. The chapter also includes commentary on the effects of the change in the US administration on the market and the impact of the EU’s 5th Anti-Money Laundering Directive on auction houses and dealers in Europe.
1. Global sales of art and antiques reached an estimated $50.1 billion in 2020, down 22% on 2019 and 27% since 2018.
Sales in the Global Art Market 2009–2020

2. Although all three of the major art hubs, the US, the UK, and Greater China, experienced a decline in sales, these key markets continued to account for a majority of the value of global sales in 2020, at 82%.
Global Art Market Share of the US, UK, and Greater China 2011-2020

3. Despite its biggest fall in sales since 2009, the US market retained its leading position, with a share of 42% of global sales values, with China and the UK on par at 20%.
Global Art Market Share by Value in 2020

Chapter 2 Dealer Sales in 2020
Chapter 2 focuses on dealers and galleries, analyzing sales and other key indicators, assessing how the COVID-
19 pandemic has impacted on different value segments and sectors of the market. This chapter looks at costs, margins,
and debt in the sector as well as artist representation. It also addresses the changing priorities and outlook for dealers in 2021.
1. The fallout from the COVID-19 crisis had a negative effect on aggregate dealer sales, with values declining by 20% to an estimated $29.3 billion in 2020, after a marginal increase of 2% in 2019.

2. A survey of the dealer sector at the end of 2020 revealed an average year-on-year decline in sales of 23%. The most significant average annual declines were reported by dealers with turnover greater than $10 million, at 31%.
Average Changes in Year-on-Year Turnover by Dealer Turnover Segment 2019–2020

3. The ability to reduce major operating costs allowed some dealers to maintain profitability in 2020: 28% were more profitable than in 2019 and 18% maintained a stable level of net profit.

4. Dealers’ top priorities shifted markedly over 2020 to focus on existing clients, online sales, and finding ways to cut costs. Client relationships, online sales, and art fairs were their top priorities looking ahead to 2021.
Top Business Priorities for Dealers in 2019 and 2020

Chapter 3 Auction Sales
Chapter 3 looks at the auction sector, analyzing key trends in sales by region and value segment, and how they have
been impacted by the pandemic in 2020. It presents a comprehensive analysis of some of the principal fine art auction
sectors, describing their performance in terms of sales, regional market share, and price distribution.
1. Public auction sales of fine and decorative art and antiques (excluding private sales) were $17.6 billion in 2020, a decline of 30% on 2019. Private sales were conservatively estimated to have reached over $3.2 billion in 2020 (up 36% on 2019). Total auction sales, including public and private, were estimated to have reached $20.8 billion.
Global Public Auction Sales 2011–2020

2. Public auction sales of fine and decorative art and antiques (excluding auction house private sales) were $17.6 billion in 2020, a decline of 30% on 2019.
Total Auction Sales (Public and Private)

3. The three largest auction market hubs of Greater China, the US, and the UK maintained their dominant position in 2020, with a combined share of 81% of public auction sales by value.
Public Auction Market Global Share by Value in 2020

4. Sales over $1 million made up the majority (58%) of the total value of offline fine art public auction sales, whereas they accounted for just 6% of total online-only values. The majority of value (67%) in the online-only market was accounted for by sales between $5,000 and $250,000.
Share of Global Fine Art Auction Sales by Price Bracket (Online versus Offline)

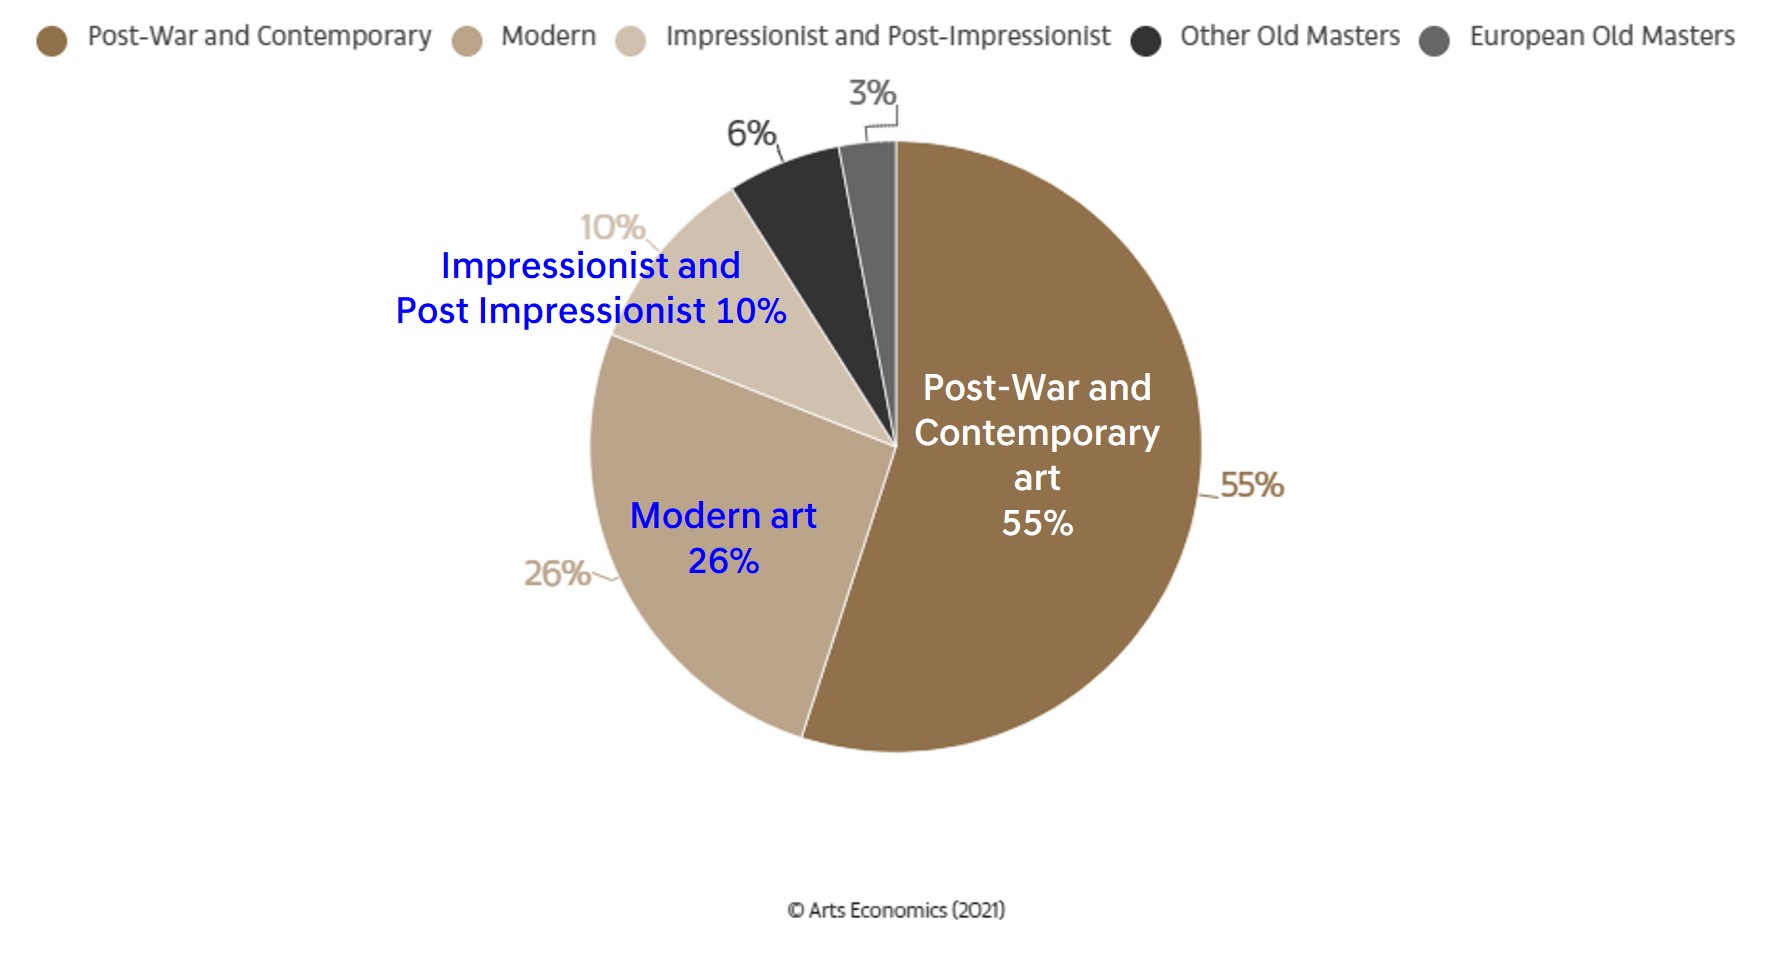
5. In 2020, the largest sector in the fine art public auction market by value was again Post-War and Contemporary art (55% by value), which along with Modern art accounted for just over 81% of the value of sales at fine art auctions.
Market Share by Sector of the Fine Art Auction Market in 2020
Chapter 4 Art Fairs and Exhibitions
Chapter 4 provides an overview of art fairs, reporting on the dramatic changes to the art fair calendar in 2020 and
the impact this has had on art fairs, galleries, and collectors. It assesses the outlook for 2021 given continuing
uncertainties, presenting the results of surveys on high net worth (HNW) collectors, art fairs, and dealers.
1. From 365 global art fairs planned for 2020, 61% were cancelled, 37% held live events, and the remaining 2% of fairs held a hybrid, alternative event.
Share of Global Art Fairs (Live Events) Cancelled in 2020 (365 Fairs)

2. The share of art fair sales from live events declined dramatically in 2020 to just 13% of dealers’ total sales, with an additional 9% share made through art fair online viewing rooms.
Share of Dealer Sales by Value by Sales Channel (Turnover-Weighted)

3. Despite the high number of events being cancelled, 41% of high net worth (HNW) collectors surveyed reported that they made a purchase at an art fair in 2020, while 45% reported making one through an art fair’s online viewing room.
Share of HNW Collectors Purchasing from Art Fairs in 2020 by Location

Chapter 5 Online Sales
Chapter 5 looks at the online art market, and the rapid evolution in sales in 2021. The chapter shows how the dealer
sector shifted sales online in 2020 and at the development of online viewing rooms (OVRs). It also shows the growth
of online auctions, and provides insights into how HNW collectors have interacted with the market online and through social media.
1. Despite the contraction of sales overall, aggregate online sales reached a record high of $12.4 billion, doubling in value from 2019.
The Online Art and Antiques Market 2013–2020

2. The share accounted for by online sales expanded from 9% of total sales by value in 2019 to 25% in 2020, the first time the share of e-commerce in the art market has exceeded that of general retail.
Share of Online Sales in the Art Market versus General Retail 2016–2020

3. The share of online sales in the dealer sector, including art fair OVRs, expanded threefold in 2020 to 39% from 13% in 2019. Dealers at all levels showed significant increases in the online component of their sales, with the largest advance by those in the $10 million-plus turnover segment to 47%.
Average Share of Dealer Sales by Value Made Online in 2019 versus 2020 by Level of Turnover

4. 90% of HNW collectors visited an art fair or gallery OVR in 2020, and 72% felt it was important or essential to have a price posted when they were browsing works of art for sale online.
Importance of Visible Pricing when Viewing Art for Sale Online

Chapter 6 Global Wealth and HNW Collector Perspectives
Chapter 6 provides a brief overview of some of the changes in the size and distribution of HNW wealth that have
emerged in 2020, and presents the results of a comprehensive survey of 2,569 HNW collectors, conducted in
conjunction with UBS Investor Watch. The survey covers ten regional markets, analysing the spending, preferences
and interactions of collectors in the art market in 2020.
1. Surveys of 2,569 high net worth (HNW) collectors, conducted by Arts Economics and UBS Investor Watch in ten markets indicated active engagement in the art market despite the COVID-19 pandemic, with 66% of those surveyed reporting that the pandemic had increased their interest in collecting, including 32% who reported it had significantly done so.
COVID-19 Pandemic – Effects on HNW Collectors' Appetite for Collecting Art

2. Millennial HNW collectors were the highest spenders in 2020, with 30% having spent over $1 million versus 17% of Boomers.
Share of Collectors by Expenditure Level in 2020

3. Despite the restrictions in place, HNW collectors still purchased through a range of channels, with 81% having purchased from a gallery or dealer in 2020, and 54% at auction.
Sales Channels used for Purchasing in 2020

4. Dealers were the most preferred channel for purchasing art and the majority of HNW collectors (57%) preferred buying from their gallery or physical premises, while 29% liked to purchase online and 14% by phone or email.
HNW Collector Preferences for Purchasing Art

5. HNW collectors will be active in the market in 2021, with the majority (57%) planning to purchase more works for their collections, and just over one third (35%) planning to sell works.
Collectors’ Intentions for Purchases and Sales of Art in 2021

Chapter 7 Economic Impact and Conclusions
Chapter 7 discusses the potential employment and economic effects of the pandemic on the art market, looking at
its impact on employment as well as the range of ancillary and support industries connected to the art trade. It
concludes the report by reviewing some of the key issues arising from the crisis in 2020 that may continue to affect the market in 2021.
1. It is estimated that there were approximately 305,250 businesses operating in the global art and antiques market in 2020, directly employing about 2.9 million people
2. It is estimated that there were more than 2.6 million people employed worldwide in the gallery and dealer sector in 2020, down 5% year-on-year in about 291,000 businesses.
Share of Dealers Downsizing Employment in 2020

3. There were an estimated 14,250 businesses operating in the auction market, including both online and offline companies. Employment in the sector fell by around 2% year-on-year, with significant declines in some of the top-tier auction houses.
Share of Second-Tier Auction Houses Downsizing in 2020 by Auction House Turnover

4. It is estimated that the global art trade spent $16.6 billion on a range of ancillary and external support services directly linked to their businesses, a decline of 16% year-on-year.
Ancillary Expenditure by the Global Art Trade 2019 versus 2020

5. As they continued their digital transformations, dealers and auction houses diverted more resources to IT, with spending up by close to 80% year-on-year, making it the highest element of ancillary spending at $3.5 billion.
Ancillary Expenditure 2019 versus 2020

'미술 이야기' 카테고리의 다른 글
| 샤또 무똥 로칠드 라벨 (0) | 2021.04.04 |
|---|---|
| ArtTactic의 동시대 작가 Confidence Report (0) | 2021.03.28 |
| 줄리안 슈나벨 Julian Schnabel (0) | 2021.03.14 |
| 안젤름 키퍼 Anselm Kiefer (0) | 2021.03.07 |
| 마녀의 안식일, 고야 (0) | 2021.01.30 |


